阿摩線上測驗
15. The average total cost curves for Plant 1, ATC1, and Plant 2, ATC2, are shown in the figure above. Over what output range is it efficient to operate Plant 2?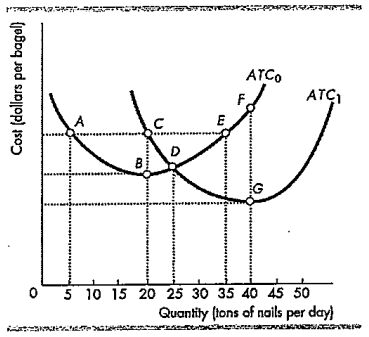
(A)0-25
(B)20-25
(C) greater than 25
(D) 0-20
答案:登入後查看
統計: 尚無統計資料
統計: 尚無統計資料