 阿摩線上測驗
題組內容
3. The following diagram illustrates a competitive firm's cost curves. MC, ATC, and AVC represent the firm's marginal costs, average total costs, and average variable costs respectively. P denotes the market price and q denotes the quantity of the good.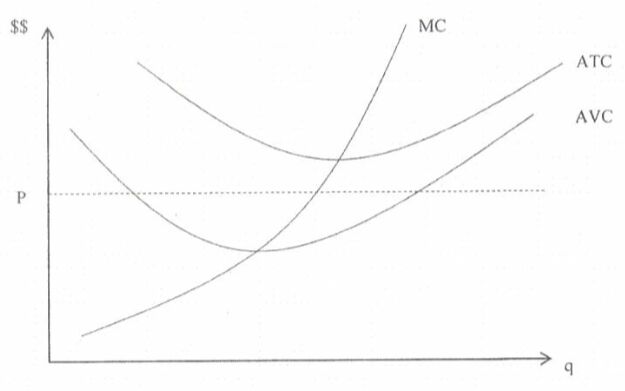
(c) What will be the long-run economic profits for the firms staying in the competitive market? How will the market supply and demand move to the long-run equilibrium? In your explanation, describe how the market price will change during the process. (5 pts)