所屬科目:研究所、轉學考(插大)◆統計學
1. A numerical description of the outcome of an experiment is called a (A) descriptive statistic (B) probability function (C) Variance (D) random variable
2. Twenty percent of the students in a class of 100 are planning to go to graduate school. The standard deviation of this binomial distribution is (A) 20 (B) 16 (C) 4 (D) 2
3. When dealing with the number of occurrences of an event over a specified interval of time or space and when the occurrence or nonoccurrence in any interval is independent of the occurrence or nonoccurrence in any other interval, the appropriate probability distribution is a (A) binomial distribution (B) Poisson distribution (C) normal distribution (D) hypergeometric probability distribution
4. A standard normal distribution is a normal distribution (A) with a mean of 1 and a standard deviation of 0 (B) with a mean of 0 and a standard deviation of 1 (C) with any mean and a standard deviation of 1 (D) with any mean and any standard deviation
5. If P( A ) = 0.4, P(B | A) = 0.35, P(A ∪ B) = 0.69, then P( B ) = (A) 0.14 (B) 0.43 (C) 0.75 (D) 0.59
6. As the sample size becomes larger, the sampling distribution of the sample mean approaches a (A) binomial distribution (B) Poisson distribution (C) normal distribution (D) chi-square distribution
7. A 95% confidence interval for a population mean is determined to be 100 to 120. If the confidence coefficient is reduced to 0.90, the interval for μ (A) becomes narrower (B) becomes wider (C) does not change (D) becomes 0.1
8. From a population that is normally distributed with an unknown standard deviation, a sample of 25 elements is selected. For the interval estimation of μ, the proper distribution to use is the (A) standard normal distribution (B) \( z \) distribution (C) \( t \) distribution with 26 degrees of freedom (D) \( t \) distribution with 24 degrees of freedom
9. It is known that the population variance equals 484. With a 0.95 probability, the sample size that needs to be taken to estimate the population mean if the desired margin of error is 5 or less is (A) 25 (B) 74 (C) 189 (D) 75
10. The manager of an automobile dealership is considering a new bonus plan in order to increase sales. Currently, the mean sales rate per salesperson is five automobiles per month. The correct set of hypotheses for testing the effect of the bonus plan is (A) \( \mathrm{H}_0: \mu < 5 \) \( \mathrm{H}_{\mathrm{a}}: \mu \leq 5 \) (B) \( \mathrm{H}_0: \mu \leq 5 \) \( \mathrm{H}_{\mathrm{a}}: \mu > 5 \) (C) \( \mathrm{H}_0: \mu > 5 \) \( \mathrm{H}_{\mathrm{a}}: \mu \leq 5 \) (D) \( \mathrm{H}_0: \mu \geq 5 \) \( \mathrm{H}_{\mathrm{a}}: \mu < 5 \)
11. When the p-value is used for hypothesis testing, the null hypothesis is rejected if (A) \( p \) -value \( \leq \alpha \) (B) \( \alpha \leq p \) -value (C) \( p \) -value \( \geq \alpha \) (D) \( p \) -value \( = \alpha \)
12. If we are interested in testing whether the mean of population 1 is smaller than the mean of population 2, the (A) null hypothesis should state \( \mu_{1} - \mu_{2} < 0 \) (B) null hypothesis should state \( \mu_{1} - \mu_{2} > 0 \) (C) alternative hypothesis should state \( \mu_{1} - \mu_{2}\geq 0 \) (D) None of the other answers is correct.
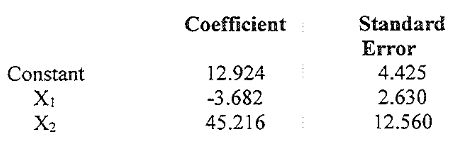
13. Below you are given a partial computer output based on a sample of 16 observations. The estimated regression equation is (A) \( y = \beta_0 + \beta_1x_1 + \beta_2x_2 + \varepsilon \) (B) \( E(y) = \beta_0 + \beta_1x_1 + \beta_2x_2 + \varepsilon \) (C) \( \hat{y} = 12.924 - 3.682x_{1} + 45.216x_{2} \) (D) \( \hat{y} = 4.425 - 2.63x_{1} + 12.56x_{2} \)
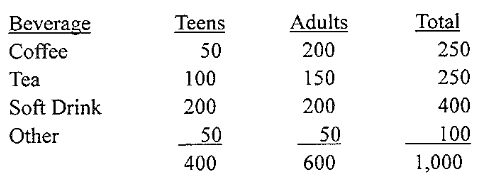
14. The table below gives beverage preferences for random samples of teens and adults. We are asked to test for independence between age (i.e., adult and teen) and drink preferences. The result of the test is that the (A) hypothesis of independence can be rejected (B) hypothesis of independence cannot be rejected (C) test is inconclusive (D) None of these alternatives is correct.
a. State the null and alternative hypotheses.
b. Fill in all the blanks in the above ANOVA table.
c. At the \( 5\% \) level of significance, test to see if there is a difference in the mean of productivity among the four programs.
a. Develop the estimated regression equation.
b. At \( a = .05 \), test for the significance of the slope.
c. Determine the coefficient of determination.
 阿摩線上測驗
登入