所屬科目:研究所、轉學考(插大)◆統計學
1. Under which of the following conditions would you suggest that a double exponential smoothing model should be used instead of a single exponential smoothing model? (A) When there are two main time-series variables involved in the forecast application (B) When the data exhibit only random variation (C) When the time-series data exhibit a trend (D) When the data set is extremely uneven
2. In a simple exponential smoothing model, which of the following statements is true? (A) The forecast values are determined by computing a moving average of the previous 4 data periods if we are working with quarterly data. (B) The larger the smoothing constant, the more smoothing that takes place in the model. (C) If the data contain a lot of random or irregular ups and downs, then a larger smoothing constant should be used in an attempt to model these fluctuations. (D) More smoothing of the data will take place if a smoothing constant value close to zero is used.
3. Which of the following forecasting methods allows the decision maker to weigh the past time series differently to make the model more sensitive to more recent data? (A) Exponential smoothing (B) Linear trend regression model (C) Moving average model (D) De-seasonalizing the time series
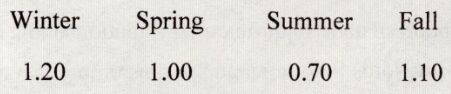
4. A company has developed a linear trend regression model based on 16 quarters of data. The independent variable is the measure of time (t = 1 thru 16 where quarter 1 is winter quarter, 2 is spring, etc.). The company has also developed seasonal indexes for each quarter as follows: The linear trend forecast equation is: $\hat{y} = 120 + 56t$. Given this information, what is the seasonally adjusted forecast for period 19? (A) 1,064 (B) 1,184 (C) 828.80 (D) 986.7
(1) Calculate the z-score for someone who smokes 100 cigarettes per week. Round both values to 2 decimals.
(2) Explain what the z-score means in plain language.
(3) Based on the correlation coefficient for age and the number of cigarettes smoked per week, please explain the relationship between these two variables in plain language.
(4) Based on what you see in this scatterplot, determine which is the independent variable and which is the dependent variable, and explain the purpose of this regression analysis.
(5) Explain in plain language what the slope and the intercept mean respectively in this example.
(6) The R square value is 0.7264, please explain what it means in plain language.
(7) Based on the regression equation given, how many cigarettes would you expect someone to smoke in an average week if they have 4 friends who smoke? Show your calculations and round to a whole number.
(8) Can you also make a prediction for someone with 15 friends that smoke?
(9) Based on the results of the regression analysis, what could be the health implications to people who smoke?
(1) Compared to 2020, how much more expensive are consumer goods and services in 2022 in Ostania? Calculate your answer in percentages and round to 2 decimals.
(2) Mr Loid Forger has been living in Ostania since 2020 and has earned €4250 net per month in 2020. In 2022 his salary was €4650 net per month. Has Mr Forger's salary, when adjusted for inflation, increased or decreased in 2022 compare to 2020? By what percentage? Show your calculations! (round to 2 decimals).
(1) What is the proportion of consumer payments made by using debit cards?
(2) What is the probability that consumers will spend more than 100,000 yuan when they use a credit card to pay for a transaction?
(3) What is the proportion of purchases paid by consumers using credit or debit cards for financial transactions?
(1) What is the average operating income of its branches?
(2) What is the proportion of operating income exceeding 175?
(1) If the sales amount in March is 88, and the number of advertisements in this month is 8. Please estimate the fitted value for the sales amount on March, 111.
(2) Continuing from the previous question, please estimate the residual value of the sales amount in March.
(3) Estimate the coefficient of determination (R2).
(4) Please estimate the correlation coefficient (CORR) between the sales amount Y and the number of advertisements X.
(5) In the case that the significant level alpha \( (\alpha) \) is equal to 0.05, please use the T test approach to test the hypothesis that the number of advertisements X affects the sales amount Y. That is, please check whether the slope value of the regression linear relationship is zero or not.
 阿摩線上測驗
登入