所屬科目:研究所、轉學考(插大)◆統計學
a. Find the probability distribution of \( X \)
b. Calculate \( \operatorname{E}[X] \)
c. Calculate \( \operatorname{Var}[X] \)
a. Formulate the hypotheses to determine whether or not the manufacturer's advertising campaign is legitimate.
b. Compute the test statistic.
c. What is the \( p \)-value associated with the sample results and what is your conclusion? Let \( \alpha = .05 \)
3. The Federal Bureau of Labor Statistics surveyed 50,000 people and found the unemployment rate to be \( 5.8\% \). The margin of error was \( 0.2\% \). Construct a confidence interval for the unemployment rate. What is the corresponding confidence level? Please interpret this confidence interval by words and graphs, and the confidence coefficient as well.(10%)
a. What hypotheses should be tested, and why?
b. In this test, what would be a Type I error?
c. In this test, what would be a Type II error?
a. If a random sample of 100 customers is chosen, what is the probability of a Type I error, using this decision rule?
b. Suppose that the true proportion of customers who cannot distinguish between these flavors is 0.20. If a random sample of 100 customers is selected, what is the probability of a Type II error?
a. Formulate the hypotheses to determine whether there is a significant difference in the means of the four populations.
b. Set up the ANOVA table for this problem including the test statistic.
c. What is your conclusion at the \( 5\% \) level of significance?
a. What has been the sample size for the above regression analysis?
b. Perform a t test and determine whether or not advertising and sales are related. Let \( \alpha = .05 \).
c. Compute the coefficient of determination and interpret the meaning of the value of the coefficient of determination that you found in Part c. Be very specific.
d. Use the estimated regression equation and predict sales for an advertising expenditure of $4000. Give your answer in dollars.
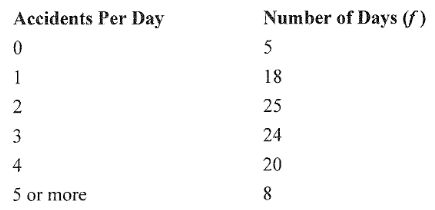
8. An insurance company has gathered the following information regarding the number of accidents reported per day over a period of 100 days.(12%)Using the critical value approach, test to see if the above data have a Poisson distribution. Let $\alpha = .05$.
 阿摩線上測驗
登入