二、The following graph represents the communication channels and their respective time delays (in minutes) between eight communication centers. The centers are depicted as vertices, the channels as edges, and the communication time delay for each channel is indicated by the weight of the edge. Suppose communication center a broadcasts news through all its channels at 8:00 a.m. Other centers will rebroadcast the news through their channels immediately upon receiving it. For communication centers b, c, d, e, f, g, and h, determine the earliest time each receives the news. (20%) 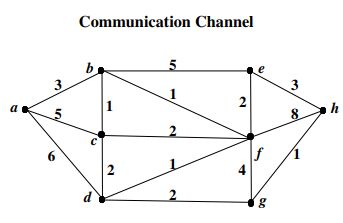
 阿摩線上測驗
登入
阿摩線上測驗
登入