 阿摩線上測驗
題組內容
第一大題
Let X be a nominal categorical random variable taking values in {0,1,2}. Let Y and Z be continuous random variables both taking values in [0,∞). Suppose you randomly select 100 samples from the population.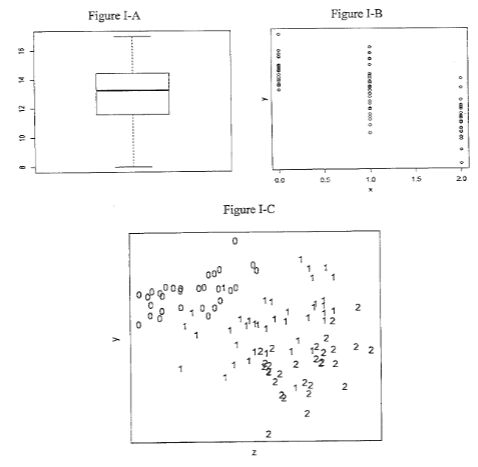
5. (5%) Figure I-C shows the scatter plot of the sample observations of Y and Z. The text labels of the data point represent the corresponding observations of X. The sample correlation between Y and Z is -0.35. According to Figure I-C, do you think it is appropriate to use this measure to quantify the relationship between variables Y and Z? Explain your reason.